
Category: Caffeine Consumption Trends
Information about how people consume caffeine and energy drinks
Caffeine Consumption in the USA – Part 2
What can 42,000 people tell us about the caffeine habits of the US population? Plenty, if you look at the right details. Understanding this information is critical to any conversation about caffeine safety. Since we’ve already reviewed the basics of this caffeine intake study in a previous post, it’s time to take a closer look at the rest of the data.
1-Battle of the Sexes: Caffeine Consumption by Gender
Based on this data, women consume more caffeine than men, per kilogram of body weight (kg/bw), but men consume more caffeine total. For both men and women, coffee is undeniably the main source of caffeine. Women consume roughly the same amount of caffeine (mg per kg/bw) from energy drinks as men do, but it’s not reported what percentage of women or men in the study are energy drink consumers.

2-Coffee Inconsistencies: What You Don’t Know About Joe
Take ten seconds and think of as many different caffeinated beverages as you can.
How many did you get?
There were 554 different caffeinated beverages recorded in this study. Each one was filed under one of six categories:

- Coffee (iced/brewed/instant/decaf etc)
- Tea (green/white/black/iced etc)
- Carbonated Soft Drinks (“CSDs”)
- Chocolate drinks
- Energy drinks (including caffeinated fruit juice, flavored water and sports drinks)
- Energy shots
That’s a lot of paper work and data entry!
To analyze caffeine habits of the population, you need to know how much caffeine is in every one of those 554 caffeinated beverages reported. Caffeine values were obtained from beverage companies, multiple USDA Food and Nutrient databases, and the Caffeine Informer caffeine database. Ironically, the most inaccurate, unreliable data included was the amount of caffeine in brewed coffee. A default-standard value was used but, case-in-point, the caffeine content of a 16 oz specialty coffee from a single location ranged from 259 to 564 mg over 6 consecutive days in one survey.
3-Decepticon: Deceptive Contents of a Data Table
In this research article, Table 2 gives a breakdown by age group of total caffeine consumed, and from what source (coffee, tea, soft drinks or energy drinks). The good news is this table highlights how dramatically caffeine habits change with age. For instance, the amount of caffeine 13-17 year olds consume is double that of 6-12 year olds. That’s not surprising as coffee shops are now popular hangouts for high schoolers. Also not surprising is the dramatic increase in caffeine consumption between ages 13-17 and 18-24. Personally, I doubt I would’ve ever made it to Monday’s 8am Organic Chemistry lecture without caffeine.
This table created by Caffeine Informer presents the best parts of Table 2:

Now for the worst parts of Table 2. Here’s an example of how a data table can create more confusion than clarity.
Look at the breakdown for 13-17 year olds in Table 2, below. The table indicates this group consumes on average 83 milligrams of caffeine: 24 mg from coffee, 28 from carbonated soft drinks, 23 mg from tea, and 6 mg from energy drinks.
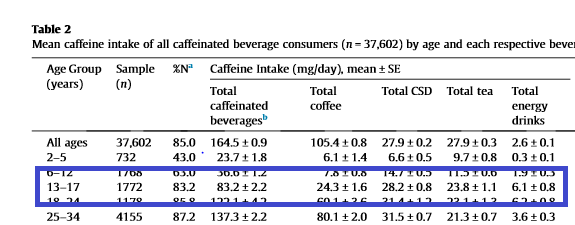 See the problem? There is no energy drink that contains 6 mg of caffeine.
What they’re trying to show is which source of caffeine contributes the most. For 13-17 year olds, most of the caffeine they’re consuming comes from carbonated soft drinks. To understand why the numbers are the way they are, imagine all the 13-17 year olds who DO drink caffeine poured every ounce of their caffeine from every source into one big giant caffeine pool. In that pool, there’d only be 6mg caffeine that came from energy drinks for everyone. But not everyone drinks energy drinks, so some people get more than their fair share.
When you do the math, the numbers do work out.
 Instead of walking you through my math, let’s just skip right on over to the incredibly helpful Table 3.
4-Analysis Paralysis: What To Do When All the Info You’ve Ever Dreamed of is in One Handy Chart
Behold, the mother of all caffeine consumption charts. There is so much information here it’s easy to get lost in the numbers. This is what we call “Analysis Paralysis.” All of this information is useful though, especially to those who care about caffeine consumption patterns among kids and teens. The best way to find the information you’re looking for is to create a fill-in-the-blank.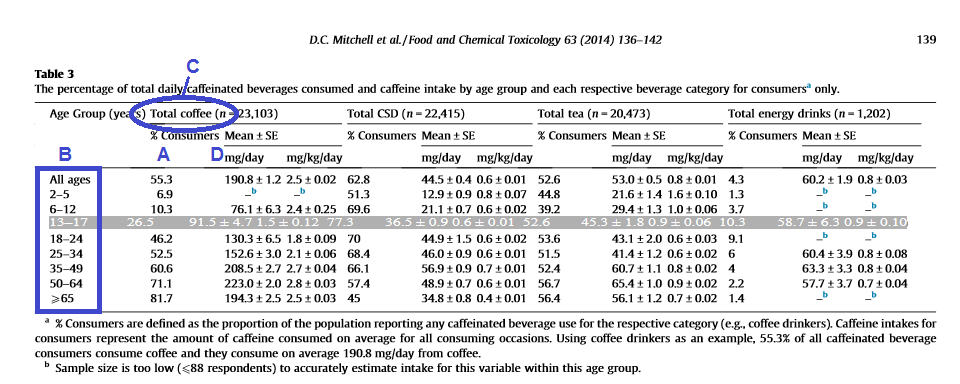
[A]% of all [B] who consume caffeine consume [C], at [D] mg per day on average. (Note: B stays the same, but I’ve only marked the A, D and C columns for coffee)
Examples:
55% of all age groups who consume caffeine consume coffee, at 190 mg per day on average.
69% of all 6-12 year olds who consume caffeine consume carbonated soft drinks (CDS), at 21 mg per day on average.
10.3% of all 13-17 year olds who consume caffeine consume energy drinks, at 58.7 mg per day on average.
5-Key Takeaways: Truly Understanding Caffeine Habits for Tweens, Teens and College Kids
Any conversation around caffeine safety should consider all sources of caffeine, not just energy drinks. Though energy drinks often contain more caffeine per serving than tea and carbonated soft drinks, coffee beverages can also provide large amounts of caffeine per serving.
In this study, teenagers and young adults are the biggest proportion of energy drink consumers, but still, less than 10% of tweens, teens and young adults get their caffeine from this source (about 70% get their caffeine from carbonated soft drinks). Teens who use energy drinks consume on average 60 mg caffeine per day, which is under the 100mg limit for adolescents proposed by the American Academy of Pediatrics. For age groups 6-12 and 18-24 there weren’t enough energy drink consumers to calculate intake averages, but the total amount of caffeine (from all sources) consumed by those under 18 is still under this 100mg limit.
As I pointed out in the previous post, perhaps all the energy drink consumers were too busy to participate in the survey, but we’ll never know for certain. The demographics of the people who took this survey was controlled to mirror the demographics of the US population, so this data should be considered a reflection of US caffeine intake habits.
Click here to access the full scientific study, Beverage caffeine intakes in the US.
Related Reading: “Energy Drink Ban: Should Children Be Restricted from Buying?”
______________________________________________________________________________________
“Like” on Facebook: https://www.facebook.com/energydrinkguide
Follow on Twitter: @GreenEyedGuide

Caffeine Consumption in the USA
A study published in January 2014 involving over 40,000 people defines beverage caffeine intakes in the US, revealing the amounts of caffeine consumed and from what source per age group. As your Green-Eyed Guide, I’m going to explain what it all means.
The following is a scientist to non-scientist translation of the article “Beverage caffeine intakes in the U.S.”, published in Food and Chemical Toxicology 63 (2014) 136-142, which is available HERE.
